kWh per kWp Calculator
Work out the specific yield of a solar array in kWh per kWp per year for your location, tilt and direction, month by month.
Quick answer
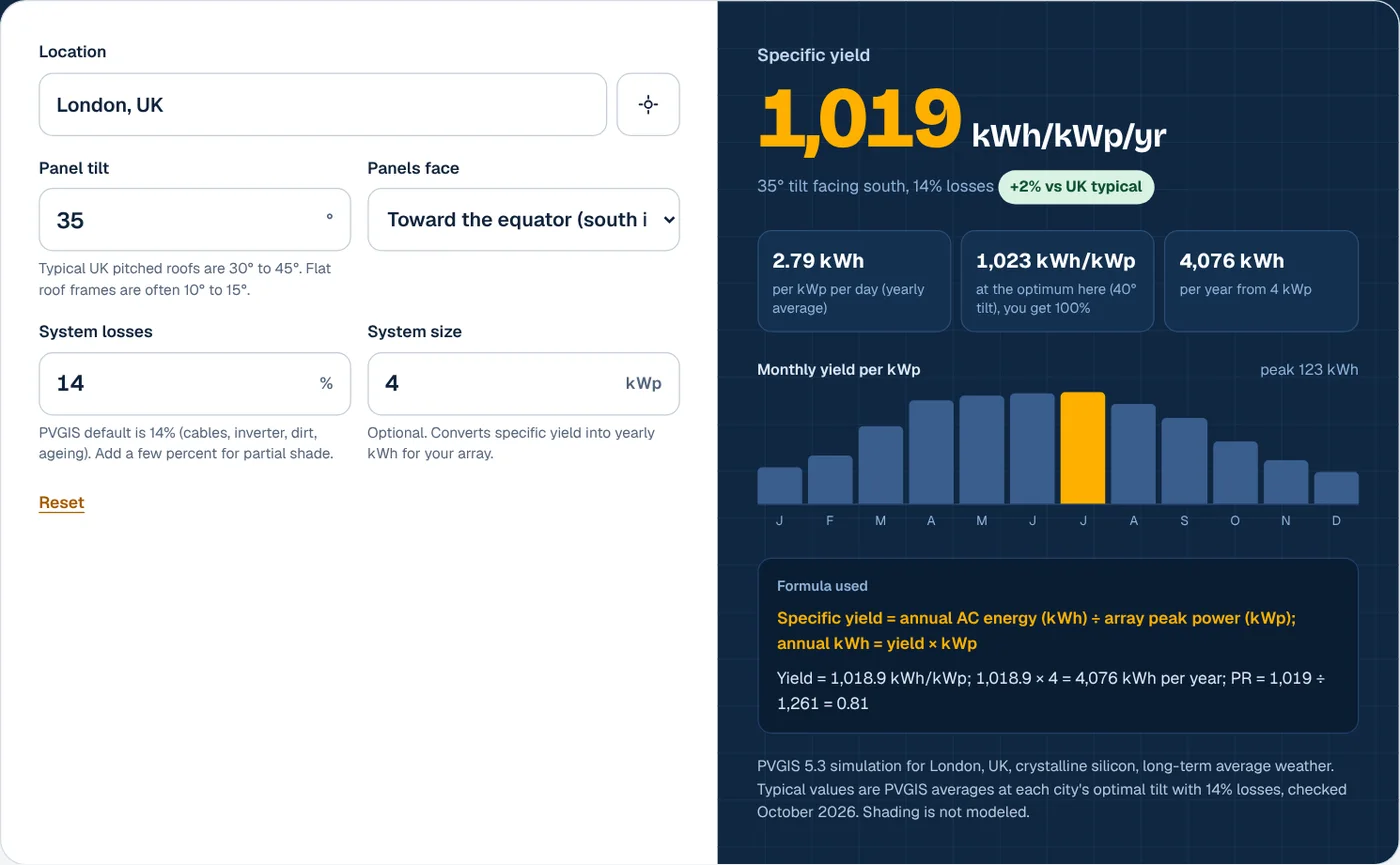
kWh per kWp (specific yield) is the electricity a solar array makes in a year for each kilowatt-peak of panels. In London, panels at 35° facing south make about 1,019 kWh/kWp a year, so a 4 kWp system gives about 4,076 kWh. The UK typically ranges from 860 to 1,160 kWh/kWp, the US from about 1,170 to 1,830 and Australia from about 1,360 to 1,690.
How to use the kWh per kWp calculator
- Set your location. Search for a city, town or postcode, or use your device location. The calculator runs a PVGIS simulation for that exact point.

- Enter the panel tilt and direction. Use your roof pitch in degrees and the way the panels face. Most UK pitched roofs are 30° to 45°.

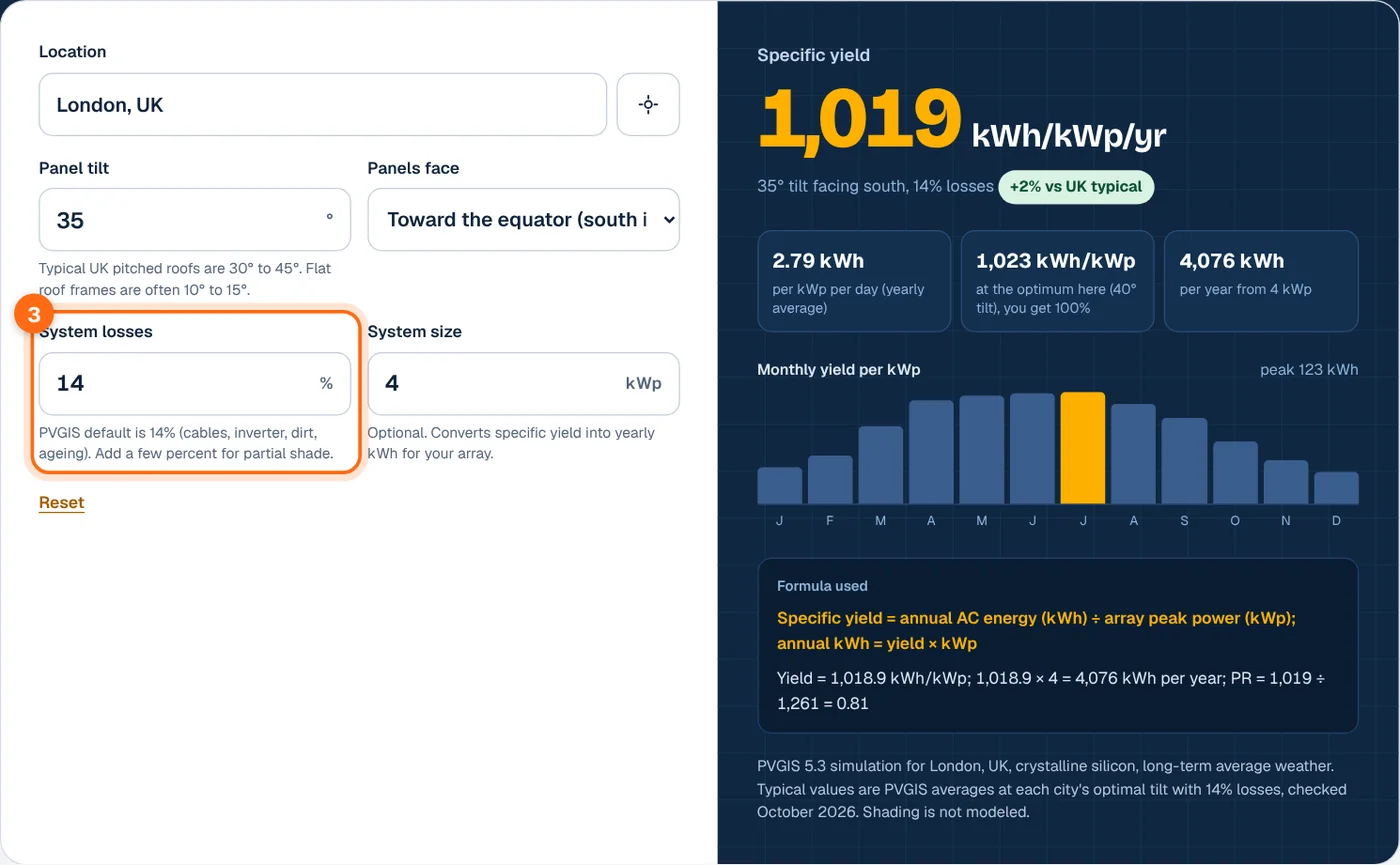
- Set the system losses. The PVGIS default of 14% covers cables, the inverter, dirt and ageing. Add a few percent for partial shade or an older inverter.
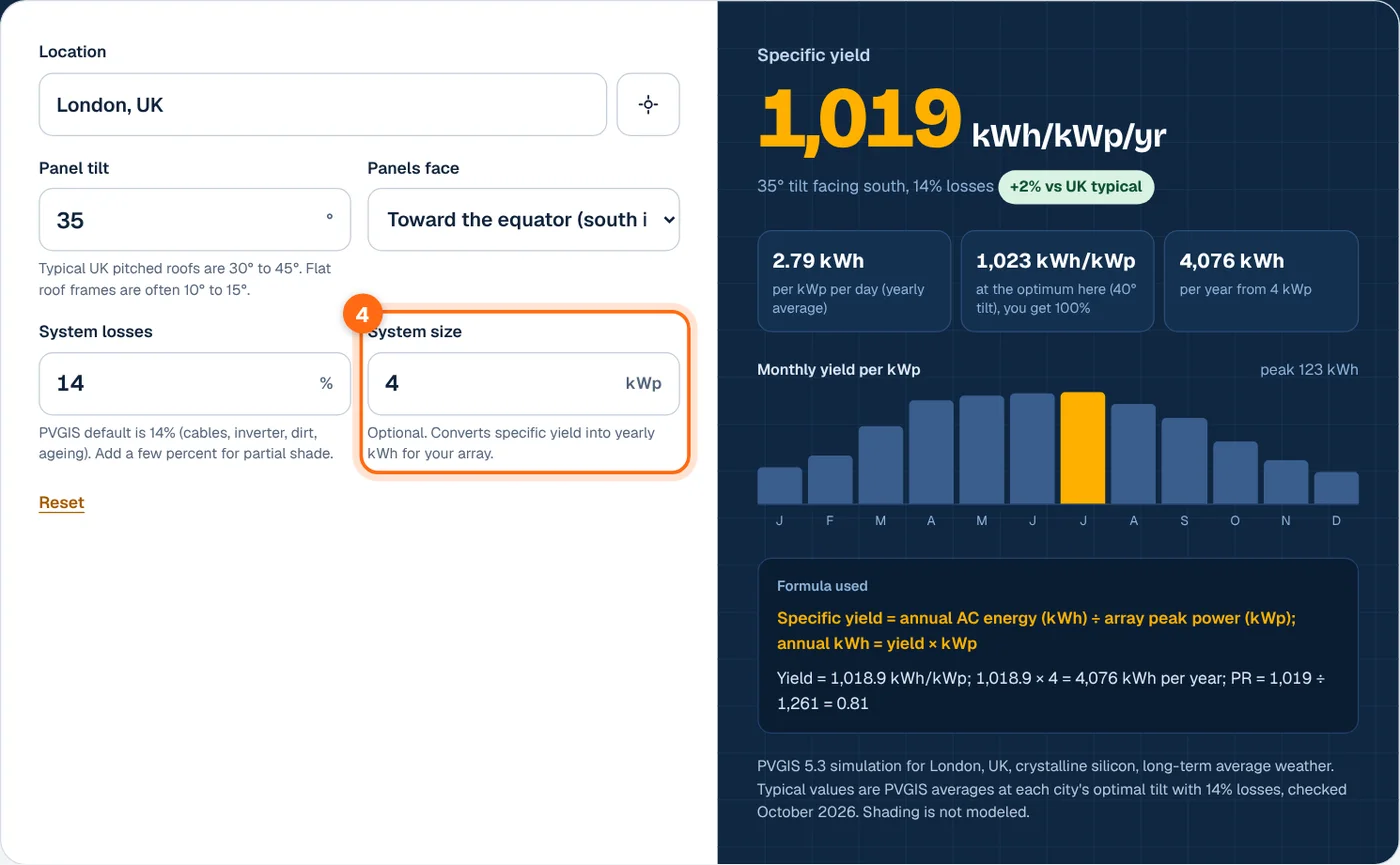
- Enter the system size (optional). Type your array size in kWp to turn the specific yield into a yearly total. Leave it at 0 to compare with typical UK, US and Australian values.
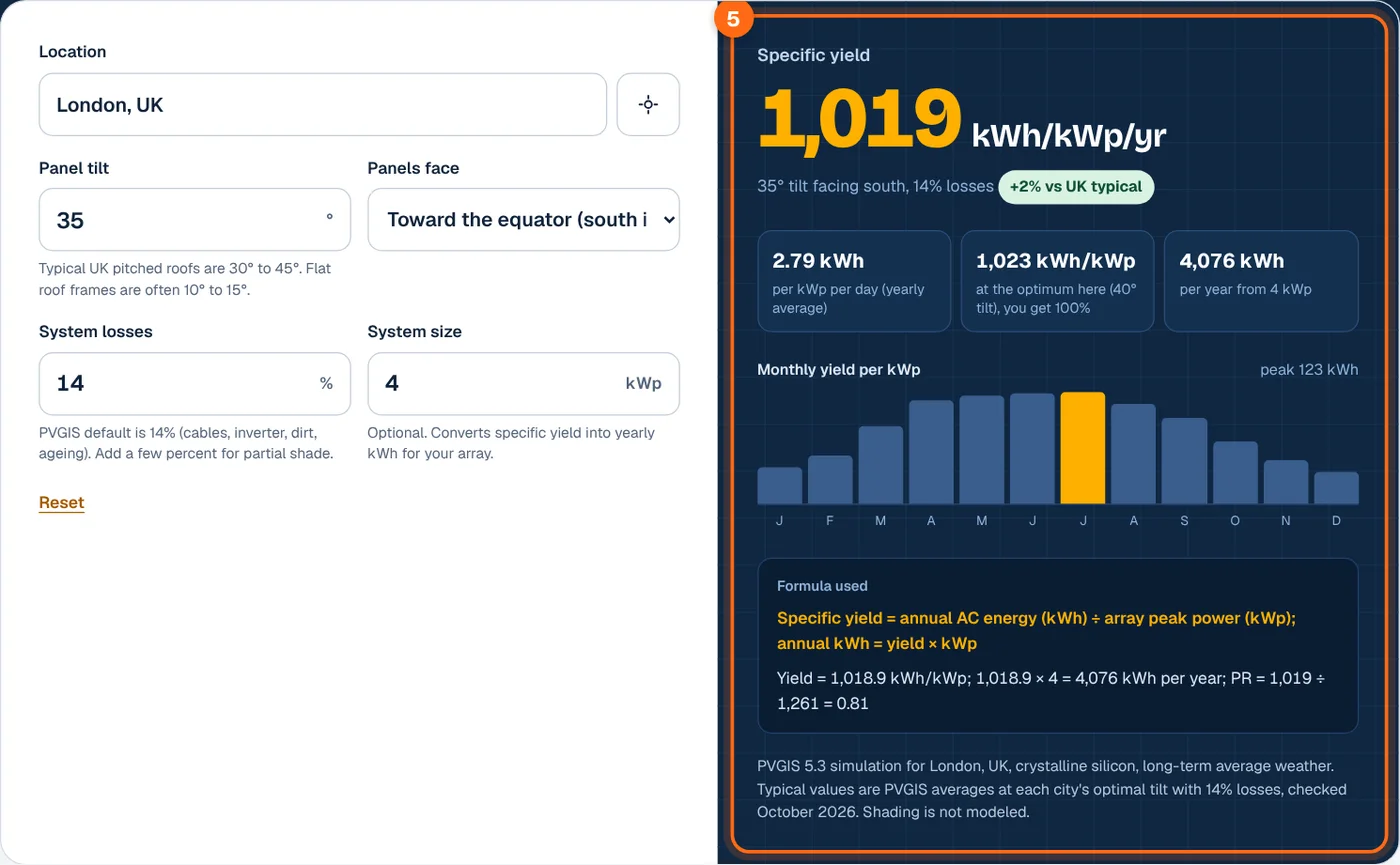
- Read the specific yield. The big number is kWh per kWp per year, with a chip showing how it compares with the typical value for your country. The cards show the daily figure, the optimum for your location and your yearly total, and the chart shows each month.
kWh per kWp formula
Where:
- Y is the specific yield in kWh/kWp per year.
- Eyear is the yearly AC electricity from the system in kWh.
- Ppeak is the array’s rated power in kWp, the sum of the panel ratings at standard test conditions (1,000 W/m², 25 °C cell temperature).
- Hi is the yearly in-plane irradiation in kWh/m², and PR is the performance ratio: how much of the ideal output survives heat, low light, inverter and cable losses.
The calculator gets Y from PVGIS, which simulates hourly output for crystalline silicon modules with a typical year of weather. Its user manual sets the default overall losses at 14%, which this calculator uses as its starting value.
Because yield is per kWp, it lets you compare sites and roofs regardless of system size. Installers in the UK quote it in their generation estimates, and investors use it to compare projects.
Worked examples
All yields are PVGIS 5.3 results with 14% losses, checked October 2026.
Example 1: London, 4 kWp at 35° facing south
PVGIS gives 1,018.9 kWh/kWp a year on 1,261 kWh/m² of in-plane sunlight.
June gives about 123 kWh per kWp and December only about 36, a ratio of over 3 to 1.
Example 2: Manchester vs Plymouth
The same 35° south-facing roof gives 886 kWh/kWp in Manchester and 1,118 kWh/kWp in Plymouth.
A 4 kWp system makes about 3,544 kWh a year in Manchester and 4,472 kWh in Plymouth. Location matters as much as roof direction within the UK.
Example 3: An east-facing 10° roof in London
Facing east at 10°, PVGIS gives 846 kWh/kWp.
For a 4 kWp system, that is about 3,382 kWh a year, roughly 690 kWh less than the south-facing roof in Example 1.
kWh per kWp by city
PVGIS 5.3 specific yield, 14% losses, checked October 2026. “35° equator” faces south in the UK and US and north in Australia.
| City | Optimal tilt | Yield at optimum (kWh/kWp) | 35° equator (kWh/kWp) | Performance ratio at 35° |
|---|---|---|---|---|
| Glasgow, UK | 41° | 862 | 859 | 0.81 |
| Manchester, UK | 39° | 888 | 886 | 0.81 |
| London, UK | 40° | 1,023 | 1,019 | 0.81 |
| Plymouth, UK | 39° | 1,120 | 1,118 | 0.82 |
| Berlin, Germany | 40° | 1,053 | 1,049 | 0.80 |
| Seattle, WA | 39° | 1,166 | 1,163 | 0.79 |
| New York, NY | 38° | 1,405 | 1,402 | 0.80 |
| Miami, FL | 26° | 1,529 | 1,510 | 0.76 |
| Phoenix, AZ | 33° | 1,831 | 1,829 | 0.74 |
| Melbourne, Australia | 34° | 1,434 | 1,433 | 0.79 |
| Sydney, Australia | 34° | 1,560 | 1,559 | 0.79 |
| Perth, Australia | 30° | 1,692 | 1,686 | 0.78 |
Typical values used in the calculator are averages of 10 UK cities (1,000 kWh/kWp), 10 US cities (1,530) and 8 Australian capitals (1,550), all at their optimal tilt.
What affects kWh per kWp
Sunshine at your location
Yield follows in-plane irradiation closely. Plymouth beats Glasgow by 30% on the same roof, and Phoenix makes about 1.8 times as much as London per kWp. The solar irradiance calculator shows the sunlight behind these numbers.
Tilt and direction
East or west roofs lose about 15 to 20% compared with south in the UK. The solar panel orientation calculator compares every direction at once.
Temperature
Panels lose output as they heat up, roughly 0.3 to 0.4% per °C above 25 °C. That is why hot Phoenix has a lower performance ratio (0.74) than cool Plymouth (0.82), even though it makes far more energy.
Losses and shading
Every extra percent of losses removes a percent of yield. Shade from chimneys, trees or dormers is not modeled here and can cost far more on string inverters.
Frequently asked questions
What is a good kWh per kWp in the UK?
For a south-facing roof at 30° to 40°, expect about 860 kWh/kWp in central Scotland, around 890 to 1,000 in northern and central England and 1,020 to 1,160 along the south coast. Anything above 1,000 kWh/kWp is good for the UK. East or west roofs typically give 700 to 930.
What is the difference between kW and kWp?
kWp (kilowatt-peak) is the rated output of the panels under standard test conditions: 1,000 W/m² of sunlight at 25 °C. Real output is usually lower. kW is plain power, and an inverter’s kW rating can be smaller than the array’s kWp, a common design choice.
How do I convert kWh/kWp into my yearly generation?
Multiply the specific yield by your system size in kWp. A 3.6 kWp system at 950 kWh/kWp makes about 3,420 kWh a year. Enter your system size in the calculator and it does this for you. Shade, snow and long outages reduce the real figure.
Does kWh per kWp change over time?
Yes. Panels degrade by about 0.4 to 0.5% a year for good modern modules, so specific yield falls slowly. Weather also varies by several percent from year to year. PVGIS gives a long-term average for a new system, which is what UK installers use in generation estimates.
Is kWh per kWp the same as peak sun hours?
They are related. Peak sun hours per year in kWh/m² multiplied by the performance ratio gives kWh/kWp. London’s 1,261 kWh/m² on a 35° roof × 0.81 = 1,019 kWh/kWp. Specific yield already includes system losses, so it is the more direct figure for estimating output.