Solar Panel Temperature Loss Calculator
Estimate solar panel power at real cell temperature from air temperature, sunlight, NOCT or mounting, and the temperature coefficient.
Quick answer
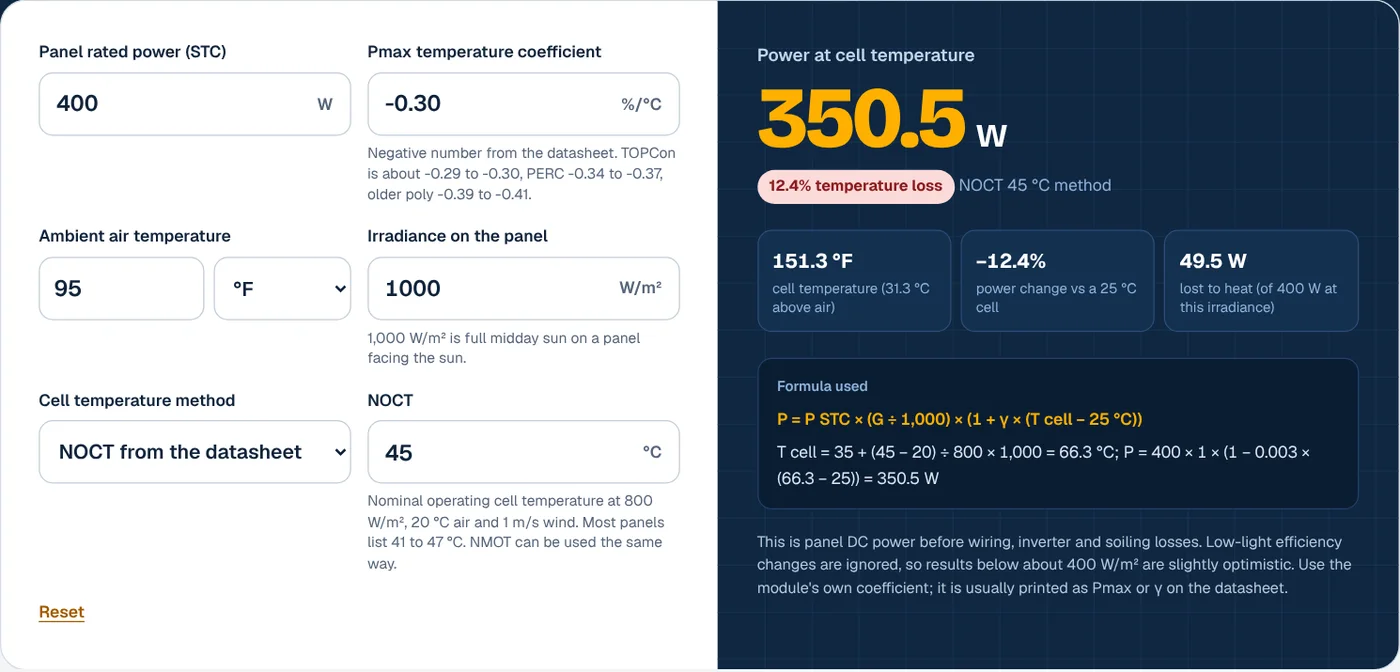
Solar panels lose power as they heat up: P = PSTC × (G ÷ 1,000) × (1 + γ × (Tcell − 25)). On a 95 °F (35 °C) day in full sun, a panel with a 45 °C NOCT runs at about 66 °C. With a -0.30 %/°C temperature coefficient, a 400 W panel then makes about 350.5 W, a 12.4% temperature loss.
How to use the solar panel temperature loss calculator
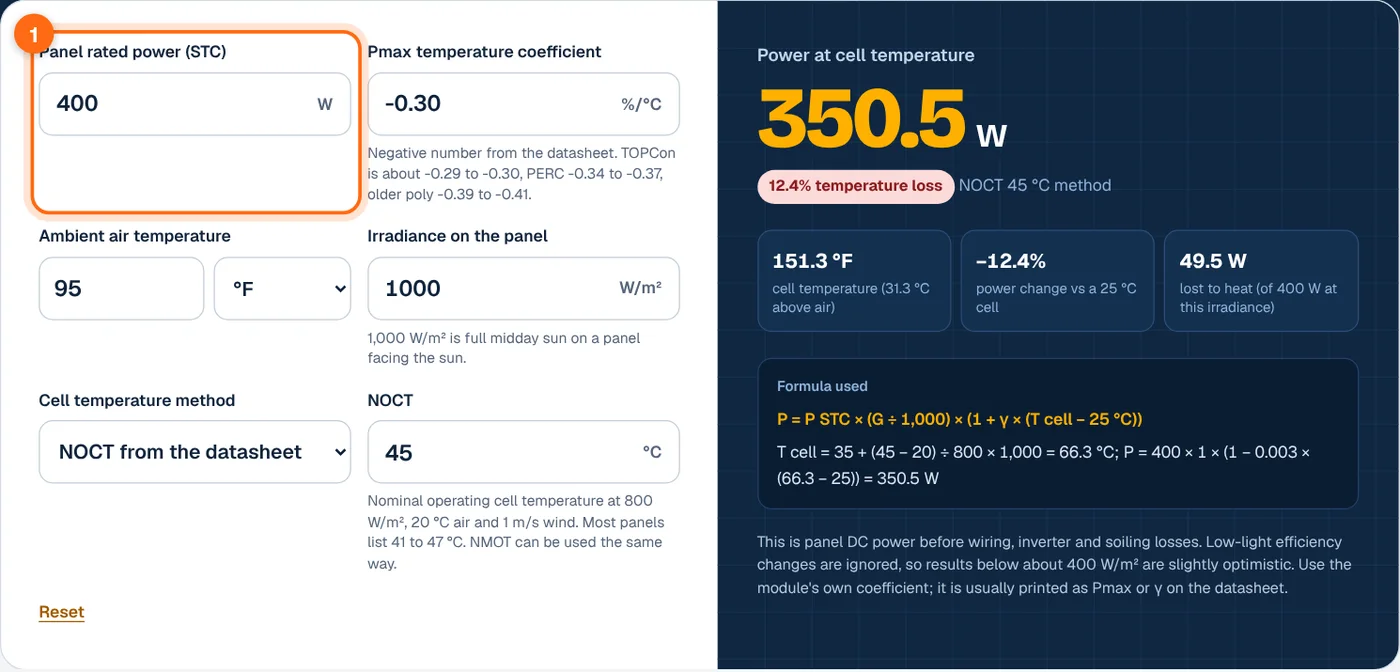
- Enter the panel’s rated power. Use the STC wattage, for example 400 W.
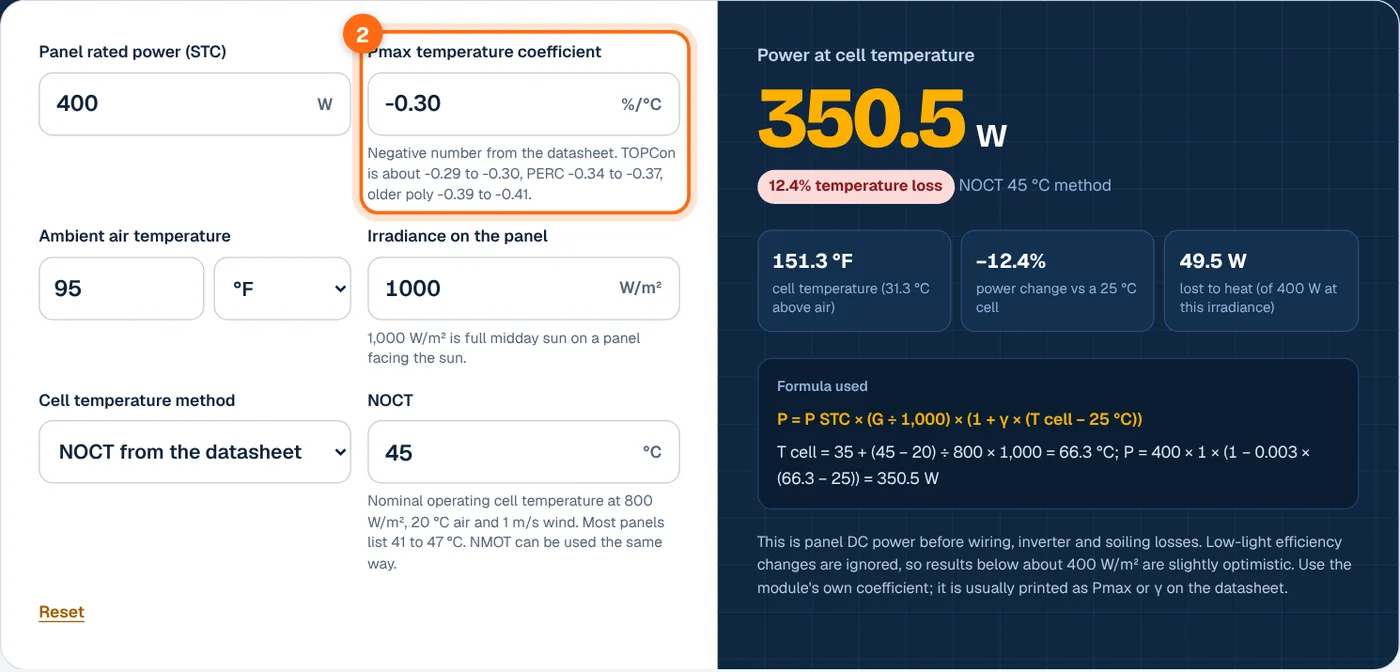
- Enter the Pmax temperature coefficient. Find it on the datasheet as γ, Pmax or Pmpp, in %/°C. It is always negative.
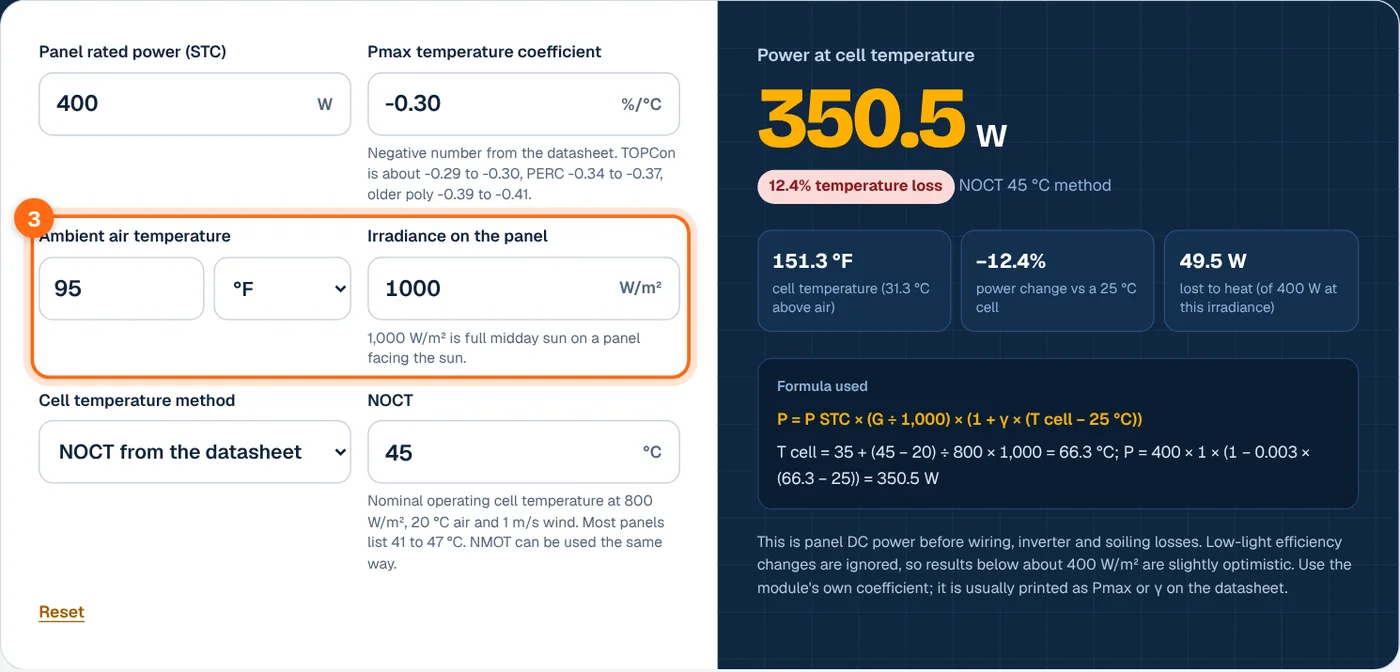
- Set the air temperature and irradiance. Enter the ambient temperature in °F or °C and the sunlight on the panel in W/m². 1,000 W/m² is full midday sun.
- Choose how to estimate cell temperature. Use the datasheet NOCT, or pick a mounting type to use the Sandia model with your wind speed.

- Read the power at cell temperature. The big number is the panel’s DC output under these conditions. The cards show the cell temperature, the percentage change and the watts lost to heat.

Solar panel temperature coefficient formula
First the calculator estimates the cell temperature, then it applies the temperature coefficient.
1. Power at cell temperature
2. Cell temperature from NOCT
3. Cell temperature from the Sandia model
Where:
- PSTC is rated power at 1,000 W/m² and 25 °C.
- G is irradiance on the panel in W/m².
- γ is the Pmax temperature coefficient as a decimal, for example -0.30 %/°C = -0.0030.
- NOCT is the nominal operating cell temperature, measured at 800 W/m², 20 °C air and 1 m/s wind.
- a, b and ΔT are empirical constants for the mounting type and WS is wind speed in m/s.
The Sandia constants come from the Sandia Array Performance Model (King, Boyson and Kratochvil, 2004). The pvlib documentation for the SAPM cell model lists them: open rack a = -3.56, b = -0.075, ΔT = 3; close roof mount a = -2.98, b = -0.0471, ΔT = 1; insulated back a = -2.81, b = -0.0455, ΔT = 0.
Worked examples
Example 1: 400 W panel on a 95 °F day (NOCT method)
95 °F is 35 °C. With NOCT 45 °C and 1,000 W/m²:
The panel loses 49.5 W, or 12.4%, to heat. A PERC panel at -0.37 %/°C would make 339 W in the same conditions.
Example 2: flush roof mount, light breeze (Sandia method)
Same day, with 2 mph (0.89 m/s) of wind and the close-mount constants:
A flush roof mount runs about 20 °C hotter than an open rack, so the loss rises to 17.9%. The open-rack model gives 64.6 °C and 352.5 W.
Example 3: a cold, sunny winter day
At -10 °C air and 600 W/m² with NOCT 45 °C:
The cells are below 25 °C, so the panel gains 4.9% over its rated output at that light level.
Temperature loss chart
Power loss in percent at each cell temperature, by Pmax temperature coefficient. Computed with P = 1 + γ × (Tcell − 25).
| Cell temperature | -0.26 %/°C (HJT) | -0.30 %/°C (TOPCon) | -0.34 %/°C | -0.37 %/°C (PERC) | -0.41 %/°C (old poly) |
|---|---|---|---|---|---|
| 35 °C (95 °F) | 2.6% | 3.0% | 3.4% | 3.7% | 4.1% |
| 45 °C (113 °F) | 5.2% | 6.0% | 6.8% | 7.4% | 8.2% |
| 55 °C (131 °F) | 7.8% | 9.0% | 10.2% | 11.1% | 12.3% |
| 65 °C (149 °F) | 10.4% | 12.0% | 13.6% | 14.8% | 16.4% |
| 75 °C (167 °F) | 13.0% | 15.0% | 17.0% | 18.5% | 20.5% |
And by air temperature, for a 400 W panel with NOCT 45 °C at 1,000 W/m²:
| Air temperature | Cell temperature | Output at -0.30 %/°C | Output at -0.37 %/°C |
|---|---|---|---|
| 50 °F (10 °C) | 41.3 °C | 380.5 W | 375.9 W |
| 68 °F (20 °C) | 51.3 °C | 368.5 W | 361.1 W |
| 86 °F (30 °C) | 61.3 °C | 356.5 W | 346.3 W |
| 95 °F (35 °C) | 66.3 °C | 350.5 W | 338.9 W |
| 104 °F (40 °C) | 71.3 °C | 344.5 W | 331.6 W |
| 113 °F (45 °C) | 76.3 °C | 338.5 W | 324.1 W |
What affects temperature loss
Temperature coefficient
This is the single biggest factor you can choose. Heterojunction panels are near -0.26 %/°C, TOPCon -0.29 to -0.30, mono PERC -0.34 to -0.37 and older polycrystalline -0.39 to -0.41. In hot climates a better coefficient is worth 2% to 4% more energy a year. The same heat also lowers string voltage, so hot-day Vmp is one of the checks in the solar string size calculator.
Mounting and airflow
Panels shed heat from both faces. A ground mount or tilted rack with open air behind it runs coolest. Flush roof mounts trap heat, and panels laid directly on an insulated surface run hottest of all.
Wind
Wind carries heat away fast. In the Sandia model, raising wind from 1 m/s to 5 m/s cools an open-rack panel at 1,000 W/m² by about 7 °C.
Irradiance
Cells heat up roughly in proportion to sunlight, so the temperature rise above air is largest at midday. Annual energy loss from heat is smaller than the midday loss, often 5% to 10% in hot climates. The solar panel output calculator includes typical temperature losses in its yearly figures.
Frequently asked questions
How much power do solar panels lose in heat?
A panel loses its temperature coefficient for every degree Celsius above 25 °C. At -0.30 %/°C and a 66 °C cell, which is common on a 95 °F day, the loss is about 12%. Older panels at -0.41 %/°C lose about 17% under the same conditions.
What is a good temperature coefficient for solar panels?
Anything better than -0.30 %/°C is good for 2026. TOPCon panels sit near -0.29 to -0.30 and heterojunction near -0.24 to -0.26. Mono PERC at -0.34 to -0.37 is acceptable in cool climates, but costs noticeably more energy in hot ones such as Arizona or Texas.
What is NOCT on a solar panel?
NOCT is the nominal operating cell temperature: how hot the cells get at 800 W/m² of sun, 20 °C air and 1 m/s wind with the panel open at the back. Most panels list 41 °C to 47 °C. Some newer datasheets list NMOT instead, which you can use the same way.
Do solar panels work better in cold weather?
Yes, per unit of sunlight. Cold cells have higher voltage, so a panel at 10 °C makes about 4.5% more than its rating at the same irradiance. Winter output is still lower overall because days are short and the sun is low. Cold also raises string voltage, which matters for inverter limits.
How hot do solar panels get?
On a hot, sunny day, cells usually run 25 °C to 35 °C above the air temperature on an open rack and up to 50 °C above it on a flush roof mount. On a 95 °F day that means about 150 °F to 185 °F. Panels are rated to operate up to 85 °C.