LiFePO4 Voltage Chart: 12V, 24V and 48V State of Charge
Short answer
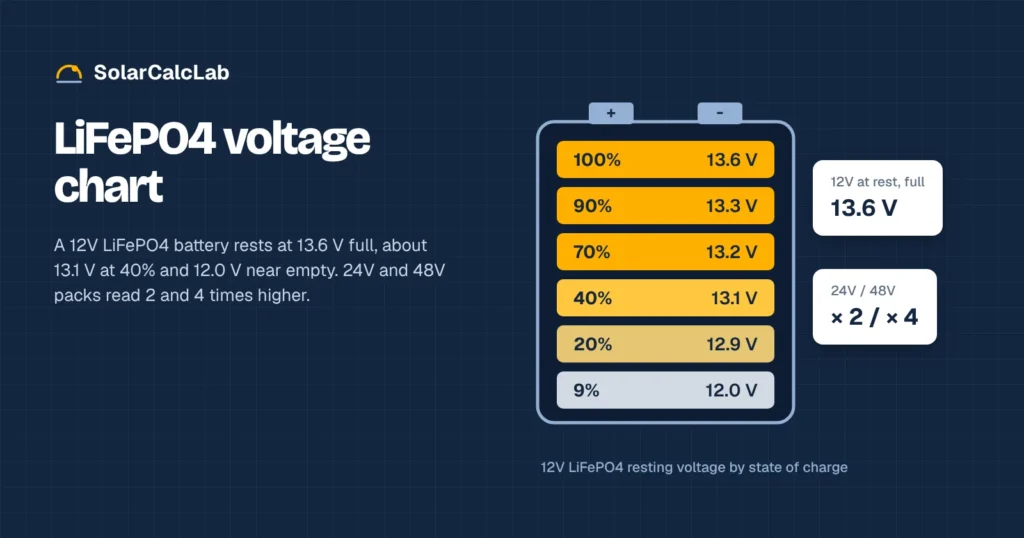
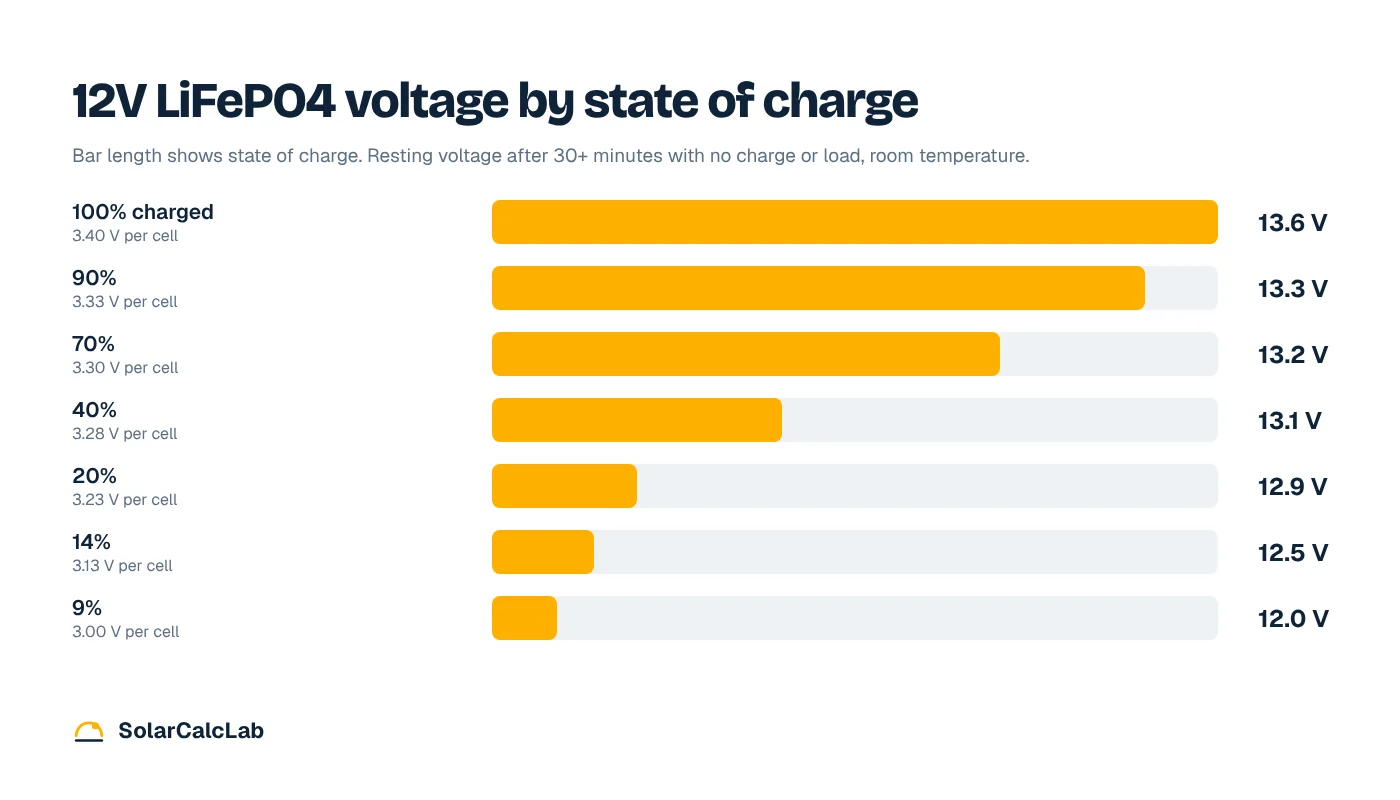
A 12V LiFePO4 battery reads about 13.6 V at rest when full, 13.3 V at 90%, 13.2 V at 70%, 13.1 V at 40%, 12.9 V at 20% and 12.0 V at roughly 9%. A 24V pack reads double those numbers and a 48V (51.2 V nominal) pack reads four times them. Measure only after the battery has rested with no charge or load.
Lithium iron phosphate batteries hold an almost flat voltage for most of their capacity, which is great for your appliances and frustrating when you want to know how full the battery is. A difference of 0.1 V can mean 30% of the battery’s energy, so a rough guess from a lead-acid chart will mislead you badly.
This LiFePO4 voltage chart covers a single 3.2 V cell and the three common pack sizes, 12V, 24V and 48V. Below it you will find the charging voltages, the formula for working out how much energy is left, three worked examples and the reasons your meter may disagree with the chart.
LiFePO4 voltage chart: 12V, 24V and 48V
These are resting (open circuit) voltages at room temperature, measured after the battery has sat for at least 30 minutes with nothing charging or drawing from it. A 12V pack has 4 cells in series, a 24V pack has 8 and a 48V pack has 16, so each column is simply the cell voltage multiplied by the cell count.
| State of charge | Per cell (3.2 V) | 12V battery | 24V battery | 48V battery |
|---|---|---|---|---|
| 100% (while charging) | 3.65 V | 14.6 V | 29.2 V | 58.4 V |
| 100% (at rest) | 3.40 V | 13.6 V | 27.2 V | 54.4 V |
| 99% | 3.35 V | 13.4 V | 26.8 V | 53.6 V |
| 90% | 3.33 V | 13.3 V | 26.6 V | 53.2 V |
| 70% | 3.30 V | 13.2 V | 26.4 V | 52.8 V |
| 40% | 3.28 V | 13.1 V | 26.2 V | 52.4 V |
| 30% | 3.25 V | 13.0 V | 26.0 V | 52.0 V |
| 20% | 3.23 V | 12.9 V | 25.8 V | 51.6 V |
| 17% | 3.20 V | 12.8 V | 25.6 V | 51.2 V |
| 14% | 3.13 V | 12.5 V | 25.0 V | 50.0 V |
| 9% | 3.00 V | 12.0 V | 24.0 V | 48.0 V |
| 0% | 2.50 V | 10.0 V | 20.0 V | 40.0 V |
Treat every row as an estimate. Cell chemistry, temperature, age and how long the battery has rested all move the curve slightly, and your battery’s own manual always takes priority over a generic chart.
12V LiFePO4 voltage chart explained
The 12V battery is the one most people check, in RVs, boats, vans and small off-grid cabins. Its nominal voltage is 12.8 V (4 × 3.2 V), and the chart breaks into three zones:
- Above 13.4 V: the top of the curve. The battery is full or very nearly full, and the voltage falls quickly to the plateau once charging stops.
- 13.3 V down to 12.9 V: the long, flat plateau. Roughly 70% of the usable energy sits inside this 0.4 V window, which is why a voltmeter alone cannot tell 70% from 40% with any confidence.
- Below 12.8 V: the knee. Voltage now drops fast. At 12.0 V only about 9% remains, and most battery management systems (BMS) disconnect the pack somewhere between 10 V and 11 V to protect the cells.
Compare that with a 12V lead-acid battery, which falls steadily from about 12.7 V when full to about 12.2 V at half charge. A LiFePO4 battery that reads 12.7 V is not “full” by lead-acid rules. It is close to empty.
24V and 48V LiFePO4 voltage charts
A 24V LiFePO4 battery (25.6 V nominal) is common in larger RV and marine systems and in mid-size home backup. It rests at 27.2 V when full and about 26.2 V at 40%. A 48V battery, usually labeled 51.2 V because it contains 16 cells, is the standard for server rack and wall-mount home storage. It rests at 54.4 V full and about 51.6 V at 20%.
Some 48V products use 15 cells instead of 16 (48.0 V nominal). For those, multiply the per-cell column by 15. A 15-cell pack at 40% would read about 15 × 3.28 = 49.2 V, which would look nearly empty on a 16-cell chart, so check the spec sheet for the cell count before you trust any table.
Cell voltage = pack voltage ÷ number of cells
Example: 52.8 V ÷ 16 cells = 3.30 V per cell, about 70% charged
LiFePO4 charging voltages
The chart above shows resting voltages. While a charger is connected you will see higher numbers, and the charger needs the right settings to fill the battery without stressing it. Most manufacturers publish ranges close to these:
| Setting | Per cell | 12V | 24V | 48V (16 cells) |
|---|---|---|---|---|
| Bulk / absorption | 3.55 to 3.65 V | 14.2 to 14.6 V | 28.4 to 29.2 V | 56.8 to 58.4 V |
| Float (optional) | 3.375 to 3.40 V | 13.5 to 13.6 V | 27.0 to 27.2 V | 54.0 to 54.4 V |
| Typical BMS low-voltage cutoff | 2.5 V | 10.0 V | 20.0 V | 40.0 V |
| Practical low limit for long life | 3.0 V | 12.0 V | 24.0 V | 48.0 V |
Battle Born, for example, recommends a 14.4 V bulk and absorption voltage for its 12V batteries and says float charging is not necessary, though a float under 13.6 V is fine, in its LiFePO4 charging guide. Never use a lead-acid equalize mode on lithium, and do not charge LiFePO4 below freezing (32°F or 0°C) unless the battery has built-in heating or low-temperature charge protection.
To size the charger and see how long a full recharge will take, use the battery charging time calculator. If the battery is charged from panels, the charge controller calculator shows the controller size that matches your array and battery voltage.
How to read LiFePO4 voltage accurately
Most wrong readings come from measuring at the wrong moment. Follow these steps:
- Disconnect charging and loads. Turn off the charger, solar controller and inverter, or open the battery disconnect.
- Let the battery rest. Wait at least 30 minutes. After a full charge, a few hours gives a truer reading because surface charge takes time to settle.
- Measure at the battery terminals. Use a decent digital multimeter on the posts, not a reading at the far end of a long cable.
- Read to two decimal places. On a flat curve, 13.15 V and 13.25 V are different answers. A meter that shows only 13.2 V hides that detail.
- Compare with the chart for your cell count. Divide by 4, 8 or 16 if you want the per-cell value.
Voltage under load always reads lower than resting voltage. A 12V battery feeding a 1,000 W inverter may show 12.9 V even at 60% charge, then bounce back to 13.1 V a few minutes after the load stops. For day-to-day monitoring, a shunt-based battery monitor that counts amp-hours in and out is far more accurate than any voltage chart. It is also what most BMS apps use to display state of charge.
Worked examples
Example 1: 12V 100Ah battery reading 13.1 V at rest. The chart puts 13.1 V at about 40%. Stored energy is capacity × nominal voltage × state of charge:
100 Ah × 12.8 V × 0.40 = 512 Wh
That is enough to run a 50 W fridge for roughly 10 hours before inverter losses. The battery life calculator turns that into runtime for any load.
Example 2: 48V 100Ah server rack battery reading 52.4 V. 52.4 ÷ 16 = 3.275 V per cell, which is about 40%. Energy left is 100 Ah × 51.2 V × 0.40 = 2,048 Wh. With a 500 W load on a 90% efficient inverter, the battery runs about 2,048 × 0.90 ÷ 500 = 3.7 hours to empty. If you stop at a 20% reserve to protect the cells, you get about half that, roughly 1.8 hours.
Example 3: 24V 200Ah battery reading 25.8 V. That is about 20%. To get back to 90% you need to replace 70% of 200 Ah, or 140 Ah. A 40 A charger would take 140 ÷ 40 = 3.5 hours at full current, a little longer in practice because current tapers near the top. You can check the conversion between amp-hours and watt-hours with the Ah to Wh converter.
Why your reading may not match the chart
- Not enough rest time. A battery that just finished charging can read 13.5 V or more for an hour.
- Temperature. Cold cells read lower and deliver less capacity. A battery at 40°F can read noticeably below the chart at the same charge.
- Cell imbalance. If one cell runs high or low, the pack total can look normal while the BMS cuts off early. Many Bluetooth BMS apps show each cell voltage, which makes this easy to spot.
- Different cell counts. A 15-cell “48V” battery and a 16-cell “51.2V” battery need different charts.
- Age. An older battery follows a similar voltage curve but holds fewer amp-hours, so the same voltage means less energy. The battery cycle life calculator estimates how capacity fades with use.
If you are still choosing a battery, our guides to the 200Ah battery and sizing an inverter battery explain how much capacity a typical system needs.
Frequently asked questions
What voltage is a fully charged 12V LiFePO4 battery?
A fully charged 12V LiFePO4 battery reads about 14.4 to 14.6 V while on the charger and settles to about 13.6 V after resting. Within a few hours it typically drops to 13.4 V or so and stays there, which is still a full battery.
What is the lowest safe voltage for a 12V LiFePO4 battery?
Most BMS boards disconnect at about 10 V, which is 0% charge. For a longer service life, stop discharging around 12.0 V, about 9% remaining, or set your inverter’s low-voltage cutoff a little higher, near 12.4 to 12.8 V, to keep a reserve.
What voltage is 50% on a LiFePO4 battery?
On a 12V LiFePO4 battery, 50% sits between the 70% mark at 13.2 V and the 40% mark at 13.1 V, so about 13.1 to 13.15 V at rest. A 24V pack reads about 26.2 to 26.3 V and a 16-cell 48V pack about 52.4 to 52.6 V.
Is 13.2 volts good for a LiFePO4 battery?
Yes. A resting reading of 13.2 V on a 12V LiFePO4 battery means it is roughly 70% charged. Because the curve is so flat, 13.2 V could mean anything from about 50% to 80%, so use a shunt monitor if you need a precise figure.
Should I float charge a LiFePO4 battery?
Float is not required because LiFePO4 batteries have very low self-discharge. If your charger cannot disable float, set it to about 13.5 to 13.6 V for a 12V battery, 27.0 to 27.2 V for 24V or 54.0 to 54.4 V for a 16-cell 48V battery.