Solar Payback Period: Average Years and How to Calculate It

Short answer
The solar payback period is the number of years it takes for bill savings to equal what you paid for the system. Simple payback = system cost ÷ first-year savings. Without the federal tax credit, a typical 7 kW system at the 2026 US average price and electricity rate pays back in about 10 to 11 years. In our six-city comparison it ranges from about 6.5 years in New York to almost 13 in Seattle, and net billing adds 2 to 3.5 years.
Payback is the number most solar sales pitches lead with, and the one most worth checking yourself. A small change in one assumption, like how fast utility rates rise, can move it by two or three years. This page shows how to calculate it three ways, what it looks like in six US cities with real 2026 rates, and how to spot an installer estimate that is too good.
The payback formula, three ways
We use one example throughout: a 7 kW system at $2.62 per watt, the average for that size in our solar panel cost guide. That is $18,340 paid in cash, with no federal credit, since homeowner purchases installed after 2025 no longer qualify.
At 4.5 peak sun hours and 80% system efficiency, it makes 7 × 4.5 × 365 × 0.80 = 9,198 kWh in year one. The US average residential price was 18.2 cents per kWh in August 2026, according to EIA Electric Power Monthly data. That puts first-year savings at 9,198 × $0.182 = $1,674, assuming every kWh is credited at the full retail rate.
1. Simple payback
$18,340 ÷ $1,674 = 11.0 years
This is what most calculators show. It assumes rates and production stay flat forever, which is never quite true.
2. Payback with rising rates and panel aging
Utility rates usually climb, and panels lose a little output each year. Add both, and each year’s savings change:
Payback = the year cumulative savings pass $18,340
With 2.5% yearly rate increases (our assumption, not a forecast) and 0.5% yearly degradation, cumulative savings pass the cost at about 10.0 years. Rising rates pull payback in by about a year.
3. Discounted payback
A dollar saved in year 9 is worth less than a dollar you spend today, because the cash could have earned interest elsewhere. Discounted payback divides each year’s savings by (1 + discount rate) raised to the year number before adding them up.
- At a 3% discount rate, payback moves to about 11.9 years.
- At 5%, it moves to about 13.8 years.
Few quotes show this version. It is the honest one if you are pulling the money out of savings that earn real interest.
Payback in six US cities
Location changes all three inputs at once: sun, electricity price and installed price. The table below keeps the same 7 kW system and uses each city’s sun from our peak sun hours calculator, the statewide residential rate for August 2026 and the state price per watt from our cost guide. Rates rise 2.5% a year and panels degrade 0.5% a year.
| City | Sun hours | Rate | System cost | Year-1 savings | Payback, full retail credit | Payback, net billing |
|---|---|---|---|---|---|---|
| New York, NY | 4.82 | 28.6¢ | $19,390 | $2,818 | 6.5 years | 9.3 years |
| Phoenix, AZ | 6.75 | 15.1¢ | $15,750 | $2,083 | 7.1 years | 9.2 years |
| Denver, CO | 6.34 | 17.2¢ | $18,410 | $2,229 | 7.7 years | 10.2 years |
| Miami, FL | 5.48 | 15.0¢ | $14,840 | $1,680 | 8.2 years | 10.6 years |
| Chicago, IL | 4.68 | 19.3¢ | $20,510 | $1,846 | 10.1 years | 13.5 years |
| Seattle, WA | 4.06 | 14.6¢ | $17,290 | $1,212 | 12.7 years | 16.0 years |
The net billing column assumes the home uses 60% of its solar directly and exports 40% at 6 cents per kWh. Several states, including Arizona and California, now credit exports below retail for new customers, so check which column matches your utility. The net metering calculator values exports under your own rule.
Two caveats. The sun hours are for panels at the best tilt facing south, so a flatter or east-facing roof will produce less and pay back more slowly. And August rates run higher than the yearly average in some states, which flatters the numbers a little.
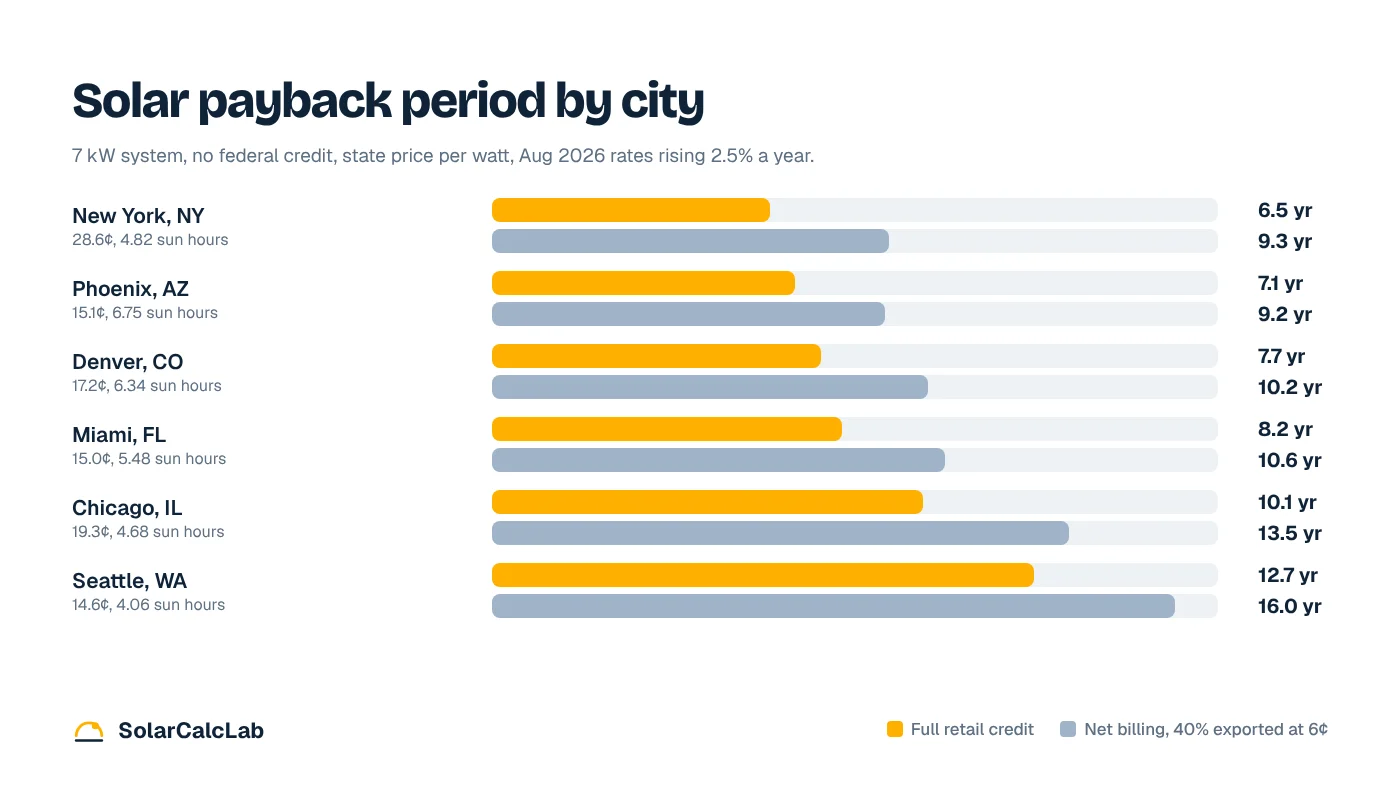
New York shows why the rate matters more than the sun. It gets about 30% less sun than Phoenix but pays almost twice as much per kWh, so it pays back sooner.
What adds years to payback
Starting from the 10.0-year national example, here is how common changes move the result:
| Change | New payback | Difference |
|---|---|---|
| None (7 kW, $18,340, 18.2¢, rates rising 2.5%) | 10.0 years | baseline |
| Production 10% lower (shade, flatter roof) | 11.0 years | +1.0 |
| Net billing: 40% exported at 6¢ | 13.2 years | +3.2 |
| Adding a $15,647 battery used only for backup | 17.2 years | +7.2 |
| Rates stay flat, panels still degrade | 11.2 years | +1.2 |
The battery row treats the battery as pure backup with no extra savings, which is the worst case. Under time-of-use rates or net billing it can earn some of its cost back, but it almost always lengthens payback for the system as a whole.
What about a loan?
With a loan, payback stops being a single year. Financing the full $18,340 over 20 years at 7.99% costs about $153 a month. Year-one savings average about $140 a month, so the household is roughly $14 a month behind at first. In this example, rising rates push savings past the payment in year 6, and the system is cash-positive from then on. The solar finance calculator compares loan offers by total cost.
Inverter replacement
A string inverter often needs replacing around year 10 to 15. Budgeting $2,500 in year 12 does not change the national example, which has already paid back. In Seattle it stretches payback from 12.7 to about 14.3 years. For slow-payback homes, ask about the inverter warranty term before you sign.
How to check an installer’s payback number
An installer quote showing 6 years for our national example is not unusual, and it is usually built from a few generous assumptions stacked together. Here is what each one does:
- The 30% federal credit is still subtracted. It no longer applies to purchased systems installed after 2025, as our solar tax credit guide explains. Leaving it in cuts payback to about 7.2 years on paper.
- Rates rise 4% a year and panels never degrade. That alone gives about 9.3 years instead of 10.0.
- Production is estimated at 5.0 sun hours instead of 4.5. Combined with the two above, payback drops to about 6.2 years.
Ask for the production estimate in kWh per year, the rate escalator, the degradation rate and whether any credit is included. Then rerun it yourself with the solar payback calculator using your real rate: last 12 months of bills divided by kWh used, including delivery charges.
Industry estimates point the same way. Wood Mackenzie expected the end of the credit to push typical payback from about seven years to about nine, as reported by EnergySage in late 2025. Many quotes have not caught up.
Payback is the floor, not the finish
A short payback is good, but it is not the whole story. A system that pays back in 10 years and then saves money for another 15 or more can be a better deal than one that pays back in 8 and has a weaker export rate later. Our guide on whether solar panels are worth it carries the same math out to 25 years and turns it into a yearly return.
Frequently asked questions
What is a good solar payback period?
Anything under about 10 years is solid for a system with 25-year panel warranties, since it leaves 15 or more years of savings. Payback of 12 to 15 years can still make sense in a low-cost area, but it leaves less margin for repairs, a move or a change in export rules.
How is solar payback calculated?
Divide the net system cost by first-year bill savings for simple payback. For a more realistic figure, add up each year’s savings with rate increases and panel degradation until the total passes the cost. Our 7 kW example gives 11.0 years the simple way and 10.0 years with 2.5% yearly rate increases.
How long does it take solar panels to pay for themselves without the tax credit?
For a typical 7 kW system at the 2026 US average price and electricity rate, about 10 to 11 years with full retail credit for exports. In high-rate states like New York it can be under 7 years, and in low-rate, cloudy areas like Seattle closer to 13.
Does net metering affect payback?
Yes, often by several years. If 40% of your solar is exported at 6 cents instead of being credited at the full retail rate, payback in our national example rises from 10.0 to about 13.2 years. Using more power during daylight hours narrows that gap.
Does a battery shorten solar payback?
Usually not. A typical $15,647 battery used only for backup stretches our national example from 10.0 to about 17.2 years. A battery can earn money back under time-of-use rates or poor export credits, but it is mainly bought for backup or rate protection.