How Accurate Are Solar Calculators and Estimators?
Short answer
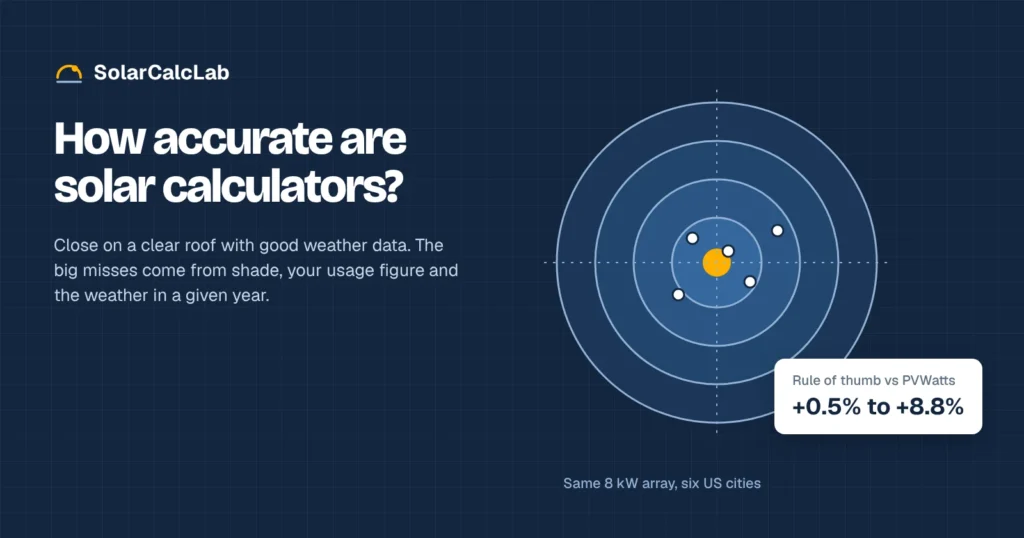
A good solar estimator that uses local weather data usually lands within a few percent of a long-term modeled average for an unshaded roof. The big misses come from three places: wrong inputs (shade, roof direction, losses), your electricity use, and the weather in any single year. A quick rule-of-thumb calculator can be off by 5% to 9% in hot or cloudy climates even when every input is right.
People ask how accurate solar calculators are for a good reason. Most homeowners see three or four different production numbers before they sign anything: one from a free online tool, one from each installer, and maybe one from a satellite roof scanner. When those numbers disagree by 15%, it is hard to know which one to trust.
The honest answer is that the math inside a solar estimator is not the weak point. The weak points are what you feed it and what it cannot know. To show where the error really comes from, we ran the same 8 kW system through NREL’s PVWatts model in six US cities, compared it with the simple peak sun hour formula many quick calculators use, and then changed one input at a time to see which ones move the answer most.
What a solar estimator is actually calculating
Every solar power estimator, from a one-line formula to installer design software, stacks three separate estimates on top of each other. Each layer has its own kind of error.
Layer 1: sunlight at your address
The tool needs to know how much solar energy reaches a panel at your location. Better tools pull this from a weather database. PVWatts, for example, uses typical-year data from the National Solar Radiation Database, built from many years of satellite and ground measurements. Simpler tools use a single average figure for your state or city, usually called peak sun hours.
Layer 2: what your system turns that sunlight into
Here the model applies panel wattage, tilt, direction, temperature, inverter efficiency and a bundle of losses for wiring, dirt, mismatch and downtime. PVWatts uses a default of 14% for those losses on top of separate inverter and temperature effects.
Layer 3: how much power you use
A production estimate only becomes a system size once it is compared with your consumption. This layer is often skipped in discussions of solar estimator accuracy, yet it causes some of the largest sizing mistakes, as the example further down shows.
One 8 kW system, six cities, two methods
We modeled an 8 kW roof-mounted array facing due south at a 25 degree tilt, with standard modules and the 14% default losses, in PVWatts version 8. Then we estimated the same system with the shortcut formula that many quick calculators use.
Example, Denver: 8 × 5.76 × 365 × 0.80 = 13,465 kWh
For a fair comparison, we used the peak sun hours that PVWatts itself reports for each array, so the sunlight input is identical. Only the conversion step differs.
| City | Peak sun hours on the array | PVWatts annual output | Rule of thumb (80%) | Rule of thumb vs PVWatts |
|---|---|---|---|---|
| Phoenix, AZ | 6.62 | 14,218 kWh | 15,468 kWh | +8.8% |
| Denver, CO | 5.76 | 13,010 kWh | 13,465 kWh | +3.5% |
| Dallas, TX | 5.49 | 12,163 kWh | 12,835 kWh | +5.5% |
| Chicago, IL | 4.58 | 10,634 kWh | 10,687 kWh | +0.5% |
| New York, NY | 4.57 | 10,491 kWh | 10,664 kWh | +1.6% |
| Seattle, WA | 4.01 | 8,838 kWh | 9,376 kWh | +6.1% |
The flat 80% factor works well in Chicago and New York, where PVWatts’ own conversion comes out near 79%. It overshoots in Phoenix, where the implied factor is about 73.5%. Hot panels lose efficiency, and a very bright site also spends more hours at the inverter’s limit. Seattle runs high for a different reason: much of its sunlight arrives on dim, overcast days and at low winter sun angles, conditions where panels and inverters convert a smaller share of it.
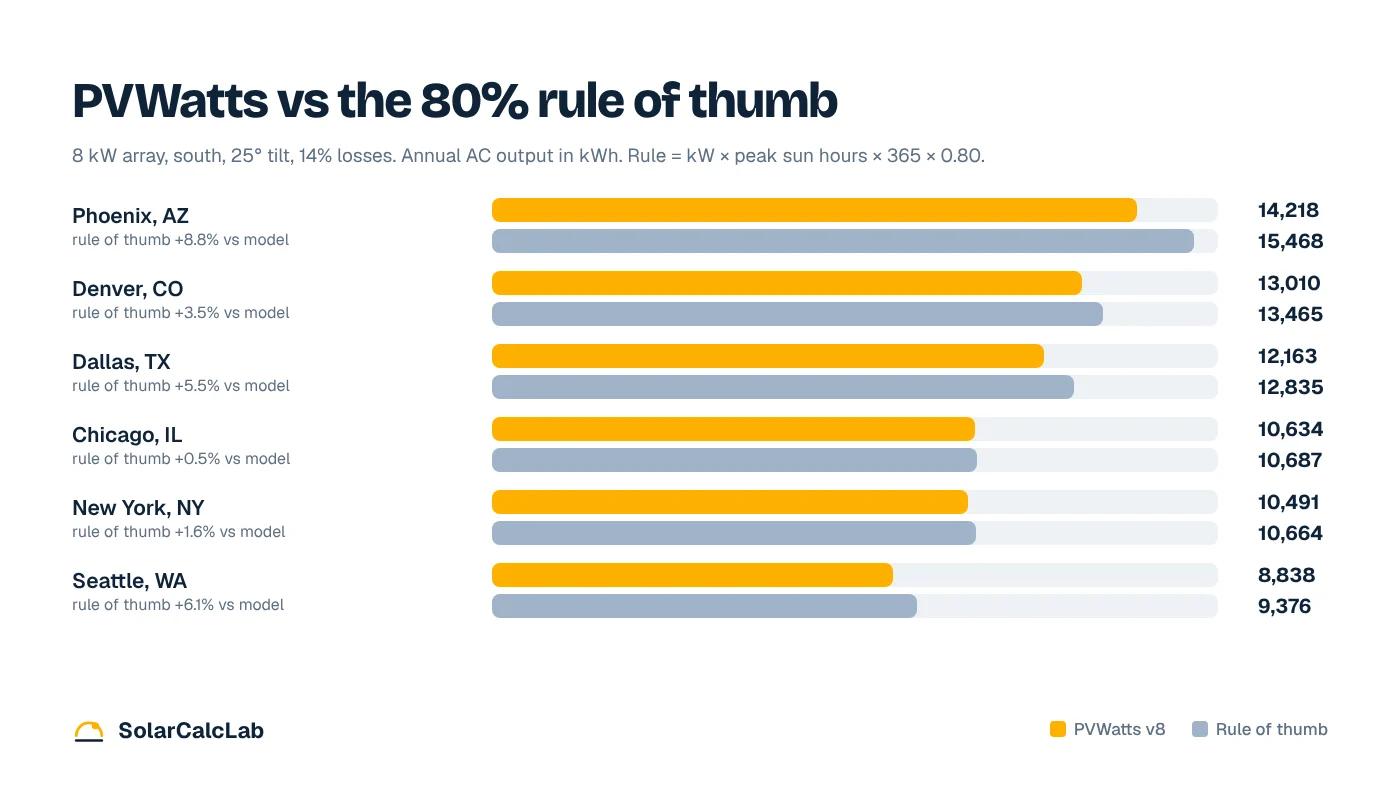
The takeaway is not that rule-of-thumb tools are useless. Within about 9% is fine for a first look. But if a quote’s production figure matches a quick 80% formula exactly in Arizona or Texas, ask how the installer handled heat.
Which inputs change the estimate the most
Next we kept the Chicago system and changed one input at a time. These are PVWatts results, not guesses.
| Change from the base case | Annual output | Change |
|---|---|---|
| Base case: south, 25° tilt, 14% losses | 10,634 kWh | None |
| Losses raised to 20% (light shade, older wiring) | 9,886 kWh | −7.0% |
| Losses raised to 30% (heavy afternoon shade) | 8,634 kWh | −18.8% |
| Panels laid flat (0° tilt) | 9,115 kWh | −14.3% |
Shade is the input most people get wrong
Nothing in a weather file knows about the oak tree next door or the chimney on the south slope. In a free calculator, shade only enters through the loss figure, and most people leave it at the default. A roof that really needs 30% losses but is entered at 14% produces an estimate almost 19% too high in this test. Satellite roof tools and installer software that model nearby objects do better here, but trees grow, and a scan from three summers ago will not show that.
Tilt and direction
Laying panels flat in Chicago cost 14.3% of annual output, mostly in winter, when the low sun hits a flat panel at a poor angle. East or west roofs fall in between. You can test your own roof angle with the solar panel orientation calculator.
The losses box
The 14% default is a reasonable starting point for a new, clean, unshaded system. Raise it for shade, heavy dust, snow that sits on the panels, or long wire runs. Lower it only if you have a specific reason, such as microinverters on a roof where every panel sees the same light.
Weather: the error no calculator can remove
Every estimator gives you a typical year. No real year is typical. Monthly output swings far more than most buyers expect, and so does the total from one year to the next.
In our Chicago model, the 8 kW array makes about 494 kWh in December and 1,248 kWh in July, a ratio of roughly 2.5 to 1. In Seattle the gap is wider: about 287 kWh in December against 1,145 kWh in August, close to 4 to 1. Judging a new system on its first winter bill is the most common reason owners think their estimate was wrong.
Year-to-year variation is smaller but never zero. PVWatts shows an expected range around its result that, in its own words, is based on 30 years of actual weather data and indicates possible variation between years. You can see it for your address on the PVWatts calculator (NREL was renamed the National Laboratory of the Rockies in late 2025, but the tool still runs).
P50 and P90 in plain terms
Some installers and most commercial reports quote a P50 and a P90 figure. P50 is the median: actual production should beat it in half of years and fall short in the other half. P90 is a cautious figure that production should exceed in about 90% of years. If a residential quote gives one number, assume it is close to P50, which means a below-estimate year is normal, not a defect. Solar data provider Solargis has a clear explanation of P50 and P90 if you want the statistics.
The usage side is often the bigger miss
A perfect production estimate still leads to the wrong system if the consumption figure is off. Here is a worked example for a Chicago home, using the PVWatts yield of about 1,329 kWh per installed kW per year.
Example: 10,200 kWh ÷ 1,329 = 7.67 kW
| Usage figure entered | Annual kWh implied | System size suggested |
|---|---|---|
| 12 months of bills averaged (850 kWh a month) | 10,200 kWh | 7.67 kW |
| July bill only (1,250 kWh) | 15,000 kWh | 11.28 kW |
Using one summer bill oversizes this system by almost 47%, a far bigger error than any weather model produces. The fix is simple: add up 12 months of kWh from your utility account. If you are planning an EV, heat pump or electric water heater, add that load separately rather than padding everything. Our guide to how many solar panels you need walks through that sizing math, and the kWh calculator helps you estimate a new appliance’s usage.
How to check an estimate against real production
Once a system is running, compare like with like. Annual totals are the only fair test; single months mostly show weather.
- Pull the monthly estimate from your quote or a PVWatts run for your exact address, tilt and direction.
- Export actual monthly kWh from your inverter or monitoring app.
- Compare the same months, then the 12-month total once you have a full year.
Example: 9,850 kWh ÷ 10,634 kWh = 0.93, or 7% below estimate
A year at 0.93 could simply be a cloudy year. A pattern is more telling than one number.
| What you see | Likely cause | What to do |
|---|---|---|
| Low in winter, fine in summer | Normal seasonal swing, or snow cover | Wait for a full year before judging |
| Low every month by a similar amount | Losses or shade underestimated in the quote | Ask the installer which loss figure they used |
| Sudden drop that stays | Failed panel, optimizer, breaker trip or inverter fault | Check the monitoring app for errors, then call for service |
| Flat midday line on sunny days | Inverter clipping | Usually normal at a high DC to AC ratio |
| Slow decline over several years | Soiling or normal degradation | Clean if dirty; compare with the warranty curve |
For the day-by-day version of this check, our post on how much power a solar panel produces per day shows what a healthy panel should make in each season.
What the SolarCalcLab calculators show for this case
Our sunlight-based tools take location data from PVWatts for US addresses and from the European Commission’s PVGIS service elsewhere. Each tool prints the formula it used with your numbers filled in, so you can see exactly where a result comes from. Our how we calculate page lists the full method and its limits.
To reproduce the tests above, enter your system size and location in the solar panel output calculator, then raise the losses figure to match your shade. Use the peak sun hours calculator to check the sunlight input, and the temperature loss calculator if you live somewhere hot. If the results still disagree with a quote by more than 10%, the difference is usually in shade, tilt or losses, so ask the installer to show those three inputs.
Frequently asked questions
Are free online solar calculators accurate enough to size a system?
For a first estimate, yes. A tool that uses local weather data and lets you set tilt, direction and losses will usually be close for an unshaded roof. Simple peak sun hour formulas ran 0.5% to 8.8% high in our six-city test. Use the free result to sanity check quotes, then rely on a site visit for shade.
Why is my solar system producing less than the estimate?
Check the time frame first. Winter months often fall well below the yearly average, and a cloudy year can run several percent low. If every month is low by a similar amount, shade or losses were probably underestimated. A sudden drop that stays usually points to an equipment fault.
Which solar estimator tool is most accurate?
No tool is accurate with bad inputs. Models built on long-term weather data, such as PVWatts and installer design software, handle sunlight and temperature well. Tools that measure your actual roof and nearby trees handle shade better. The most accurate estimate combines a good weather model with an on-site shade check.
How much can solar production vary from year to year?
Annual totals usually stay close to the long-term average, but individual years can land several percent above or below it. Monthly swings are much larger: our Chicago model ranges from about 494 kWh in December to 1,248 kWh in July for the same 8 kW array.
Should I trust an installer’s production estimate?
Treat it as a P50-style typical year, not a promise. Ask which weather data, tilt, direction and loss figure they used, and whether the contract includes a production guarantee. Run the same inputs through a free tool. If the installer’s figure is much higher, ask them to explain the gap before you sign.