How Much Power Does a Solar Panel Produce Per Day?

Short answer
A typical 400 watt home solar panel produces about 1.4 to 2.0 kWh per day in the US, averaged over a year. That is roughly 1.45 kWh in New York, Boston or Chicago and 1.95 kWh in Phoenix. The quick math is panel watts × peak sun hours × about 0.75 to 0.80, divided by 1,000. Winter days can drop to half of the summer figure in northern states.
The wattage printed on a solar panel is what it makes in a lab, under a light of 1,000 watts per square meter with the cells held at 77°F. Your roof rarely sees those conditions, and never for a whole day. So the useful question is not “how many watts” but “how many kWh per day,” because kWh is what your utility bills you for.
Below you will find modeled daily output for a 400 W panel in nine US cities, the month-by-month swing, the losses that separate nameplate from reality, and a simple test to tell whether your own panels are underperforming. If you are sizing a whole system, our guide on how many solar panels you need takes these numbers further.
The formula for daily solar panel output
Every estimate starts from the same three inputs: the panel’s rated watts, the peak sun hours at your location and a factor for real-world losses.
Example: 400 W × 4.5 h × 0.75 ÷ 1,000 = 1.35 kWh per day
Peak sun hours
A peak sun hour is one hour of sunlight at 1,000 W per square meter. A day with 4.5 peak sun hours delivers the same energy as 4.5 hours of full lab-strength sun, even though the sun was up for 12 hours. Most of the continental US gets about 4 to 6.5 peak sun hours on a south-facing tilted roof, averaged over the year. You can look up your own figure with the peak sun hours calculator.
The system factor
This is where most quick answers go wrong. A factor of 1.0 assumes no losses at all. Real systems keep about 74% to 80% of the energy that peak sun hours suggest. When we ran nine US cities through PVWatts with its default settings, the factor ranged from 0.735 in Phoenix to 0.794 in Chicago. Hot climates sit at the low end because heat cuts panel output, which we break down further below.
How much a 400 W panel produces per day in US cities
The table uses the PVWatts calculator from the National Laboratory of the Rockies (formerly NREL). Settings: standard monocrystalline panel, fixed roof mount, 25° tilt, facing due south, default 14.08% system losses. Results are AC energy, after the inverter, scaled to one 400 W panel.
| City | Peak sun hours (yearly average) | Average kWh per day | Lowest month | Best month | kWh per year |
|---|---|---|---|---|---|
| Phoenix, AZ | 6.62 | 1.95 | Dec: 1.60 | Apr: 2.27 | 710 |
| Los Angeles, CA | 6.15 | 1.86 | Dec: 1.37 | Aug: 2.22 | 678 |
| Denver, CO | 5.76 | 1.78 | Dec: 1.34 | Jun: 2.08 | 650 |
| Miami, FL | 5.64 | 1.70 | Dec: 1.48 | Mar: 1.98 | 622 |
| Dallas, TX | 5.49 | 1.66 | Dec: 1.35 | Jun: 1.96 | 608 |
| Atlanta, GA | 5.18 | 1.55 | Dec: 1.18 | May: 1.82 | 566 |
| Chicago, IL | 4.58 | 1.46 | Dec: 0.80 | Jul: 2.01 | 531 |
| Boston, MA | 4.79 | 1.45 | Dec: 0.82 | Jul: 1.82 | 530 |
| New York, NY | 4.57 | 1.44 | Dec: 0.88 | Jun: 1.80 | 524 |
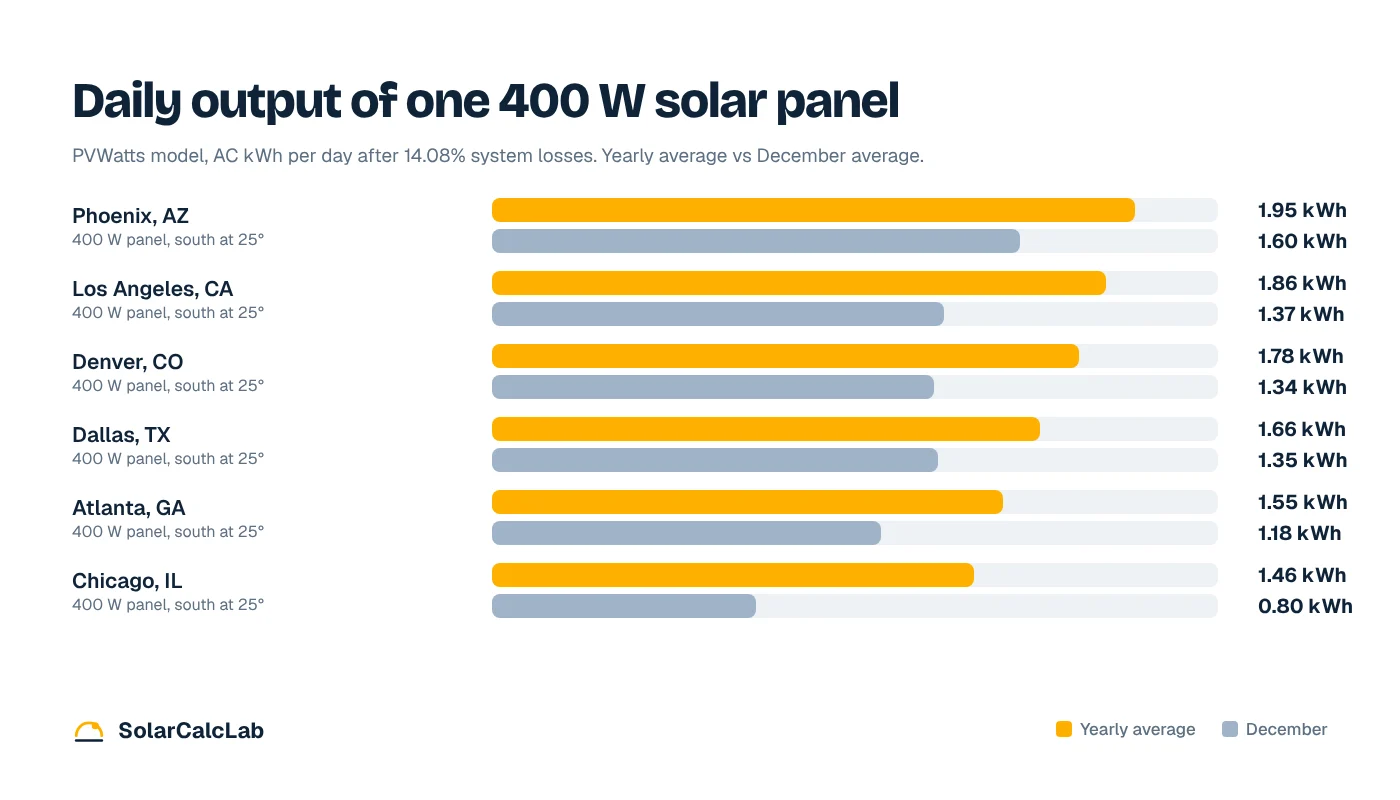
Two things stand out. First, the gap between the sunniest and cloudiest of these cities is smaller than most people expect: a panel in Phoenix makes about 34% more per year than the same panel in Boston, not double. Second, Boston beats Chicago on peak sun hours but finishes level on output. Chicago’s cooler air keeps its panels more efficient, which is exactly what the system factor captures.
Summer vs winter: the month matters more than the city
Annual averages hide the swing that matters for batteries and off-grid setups. In Phoenix, the best month produces only 1.42 times the worst. In Chicago the ratio is 2.53: a 400 W panel averages about 2.01 kWh a day in July but only 0.80 kWh in December. Boston (2.23) and New York (2.06) show the same pattern.
Shorter days are only part of the reason. The winter sun is lower, so its light passes through more atmosphere, and northern winters bring more cloud and snow cover. If you rely on a battery, the December number is the one to design around.
What the hottest days do
Panels lose output as they heat up. A typical modern panel loses about 0.3% of its power for every degree Celsius above 25°C cell temperature. On a 95°F afternoon in full sun, cells can reach around 150°F, and the solar panel temperature loss calculator shows a 400 W panel delivering about 350 W at that moment, a 12.4% loss. That is why Phoenix’s best month is April, not June.
Daily output by panel size
Smaller panels follow the same math. This table uses a system factor of 0.75, a fair middle value for US rooftops. Pick the column closest to your peak sun hours.
| Panel rating | 3.5 sun hours | 4.5 sun hours | 5.5 sun hours | 6.5 sun hours |
|---|---|---|---|---|
| 100 W (RV, shed) | 0.26 kWh | 0.34 kWh | 0.41 kWh | 0.49 kWh |
| 200 W | 0.53 kWh | 0.68 kWh | 0.82 kWh | 0.97 kWh |
| 300 W (older home panel) | 0.79 kWh | 1.01 kWh | 1.24 kWh | 1.46 kWh |
| 400 W | 1.05 kWh | 1.35 kWh | 1.65 kWh | 1.95 kWh |
| 450 W | 1.18 kWh | 1.52 kWh | 1.86 kWh | 2.19 kWh |
Portable and RV panels often do worse than this table, because they lie flat or face the wrong way and run through a smaller charge controller. Larger 500 to 600 W commercial-style modules scale the same way; our look at 600 watt solar panel output covers those.
Where the missing 20 to 25 percent goes
PVWatts applies a default 14.08% for system losses before it even considers heat and the inverter. That figure is not a guess; it is ten separate allowances combined:
| Loss category | PVWatts default | What it covers |
|---|---|---|
| Soiling | 2% | Dust, pollen, bird droppings |
| Shading | 3% | Trees, chimneys, neighboring buildings |
| Mismatch | 2% | Small differences between panels in a string |
| Wiring | 2% | Resistance in DC and AC cables |
| Connections | 0.5% | Connectors and terminals |
| Light-induced degradation | 1.5% | Early power drop in the first months |
| Nameplate rating | 1% | Panels testing slightly under their label |
| Availability | 3% | Downtime from outages, faults and maintenance |
| Snow and age | 0% | Off by default; add them for your site |
These multiply rather than add: 0.98 × 0.97 × 0.98 × 0.98 × 0.995 × 0.985 × 0.99 × 0.97 = 0.8592, a combined 14.08% loss. On top of that come temperature losses and inverter conversion, usually around 4%. Together they explain why real systems land at 74% to 80%.
The solar panel output calculator uses the same 14% default and pulls location data from PVGIS, so it already accounts for temperature. You can raise the loss figure for a dusty site, partial shade or long cable runs.
Worked examples
A 12-panel roof in Denver
Twelve 410 W panels make a 4.92 kW system. Using the Denver PVWatts result of 1,624.7 kWh per kW per year:
December: 16.4 kWh per day. June: 25.6 kWh per day
Against a household using 25 kWh a day, this system covers most of summer and about two-thirds of a December day.
A shed in Chicago running a small fridge and lights
A shed with two 200 W panels (400 W total) and loads of 1.0 kWh per day looks fine in July, when the panels average about 2.0 kWh. In December they average 0.80 kWh, a 20% shortfall before counting battery losses. Since December gives about 1.99 kWh per installed kW per day, the shed needs about 500 W to break even on average. A third 200 W panel (600 W, about 1.19 kWh in December) and a steeper winter tilt close the gap.
Are your panels underperforming? A quick check
Most systems come with an app that shows daily kWh. Compare it with the expected figure for the same month, not the yearly average.
Example: a 10-panel, 4 kW system in Atlanta should average about 18.2 kWh per day in May (141.1 kWh per kW for the month ÷ 31 days × 4 kW). If the app shows 12 kWh on a clear May day, the system is at about 66% of a typical day, which is worth a look. Work through these in order:
- Compare clear days only. One cloudy day means nothing. Look at three or four sunny days in a row.
- Check for new shade. A tree that grew a few feet since installation can shade one panel for hours, and on a string inverter that panel drags the others down.
- Look at per-panel data. With microinverters or optimizers, one panel far below its neighbors points to a fault, dirt or shade on that panel.
- Check the inverter for error codes. A tripped breaker or a stopped inverter shows as zero output, not low output.
- Inspect the surface. Pollen and dust build up in dry months. Rain usually cleans tilted panels; flat ones may need a rinse.
- Factor in age. Panels lose roughly 0.5% a year. A 10-year-old array making 5% less than its first year is normal; the solar panel degradation calculator shows the expected figure for your panel’s warranty rate.
If clear-day output stays below about 80% of the modeled figure after those checks, call your installer with the dates and numbers in hand. It also helps to know how far off the original quote could have been, which we test in how accurate solar calculators are.
Frequently asked questions
How many kWh does a 400 watt solar panel produce per day?
About 1.4 to 2.0 kWh per day averaged over a year in most US cities. PVWatts modeling gives 1.44 kWh in New York, 1.66 kWh in Dallas and 1.95 kWh in Phoenix for a south-facing roof panel at 25° tilt.
How much does a solar panel produce per hour?
It changes all day. At midday in full sun, a 400 W panel typically delivers about 280 to 340 W after heat and wiring losses, so roughly 0.3 kWh in that hour.
Do solar panels produce power on cloudy days?
Yes, but much less. Under heavy overcast, output often falls to 10% to 25% of a clear day. The monthly averages in this article already include typical cloudy days.
Why is my solar panel producing less than its wattage?
The wattage is measured at 1,000 W per square meter of light with cells at 77°F. Real sunlight is weaker for most of the day, and hot cells, dirt, wiring and the inverter all take a share. Midday output of 70% to 85% of the label is normal.
How much does one solar panel produce per month?
A 400 W panel averages about 44 kWh per month in New York, Boston or Chicago, 51 kWh in Dallas and 59 kWh in Phoenix. Expect winter months to come in lower and summer months higher than those averages.


